Monitoring orders
After you create or open an existing order from Managing orders, use the order detail page to watch provisioning progress, configuration health, and operational logs. This replaces generic “monitoring dashboard” language with what the portal actually exposes today.
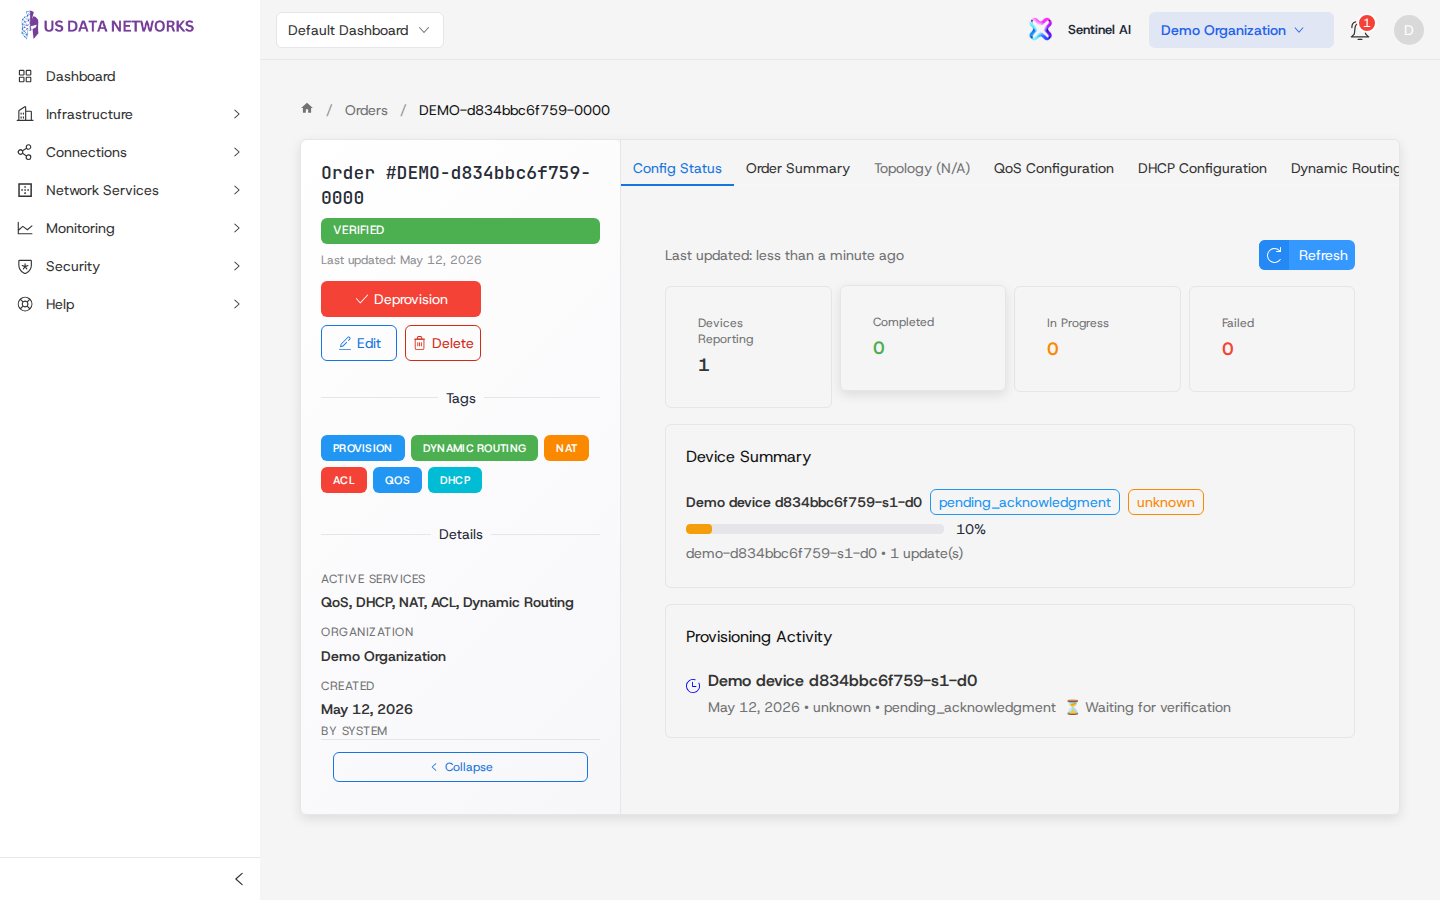
Config Status
The Config Status tab is the default place to see whether configuration has been published and applied across the devices involved in the order. Use any refresh or retry actions the UI provides when a step is stuck or after you change related infrastructure.
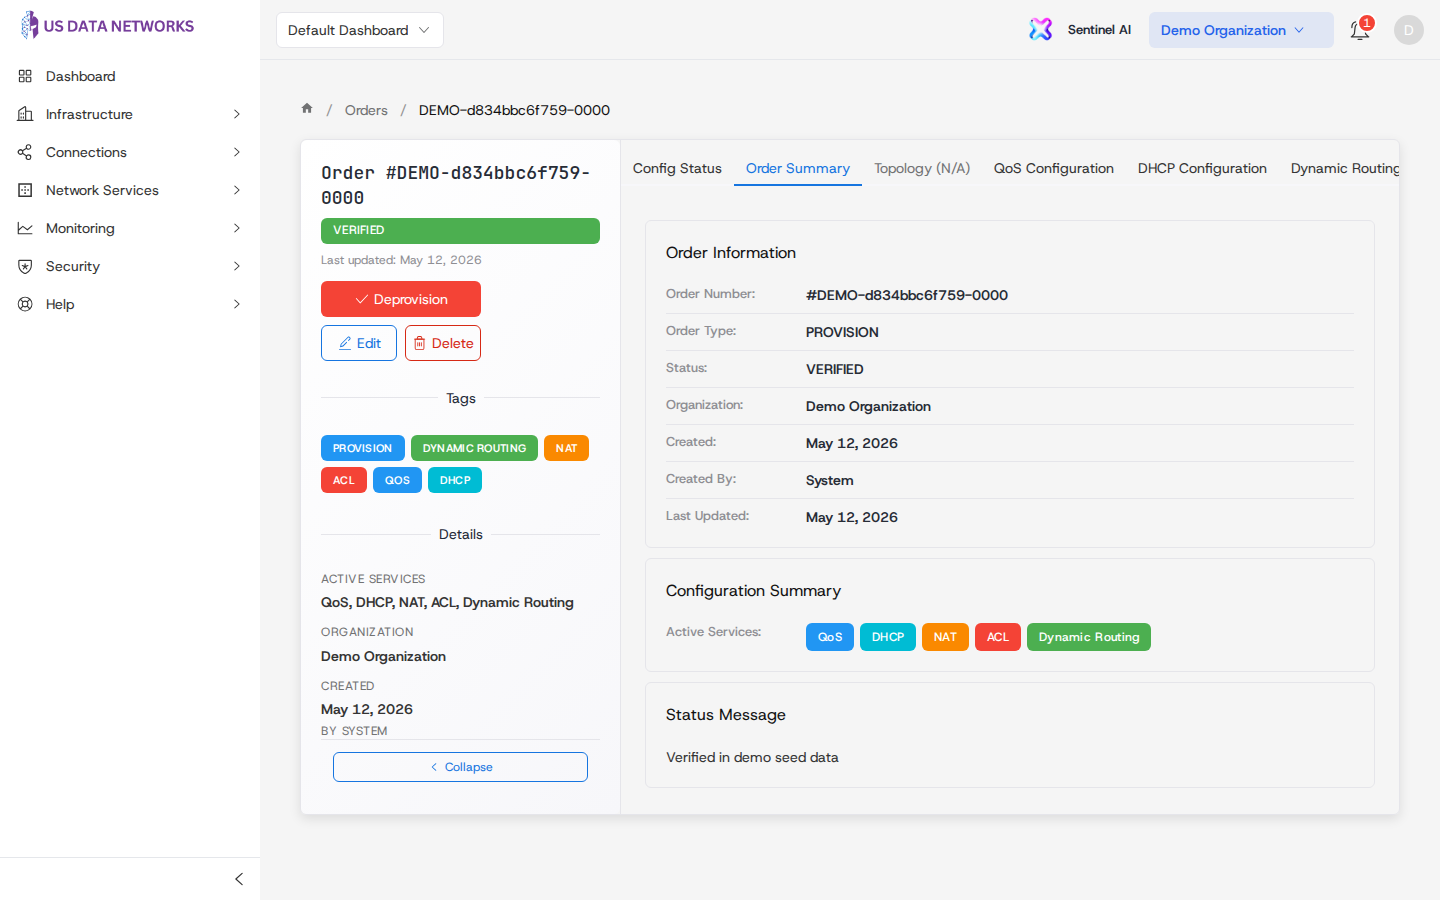
Order Summary
Switch to Order Summary for a readable snapshot: identifiers, status, organization context, tunnel counts, and feature toggles (QoS, DHCP, NAT, ACL, IDS/IPS, dynamic routing) when they apply to the order.
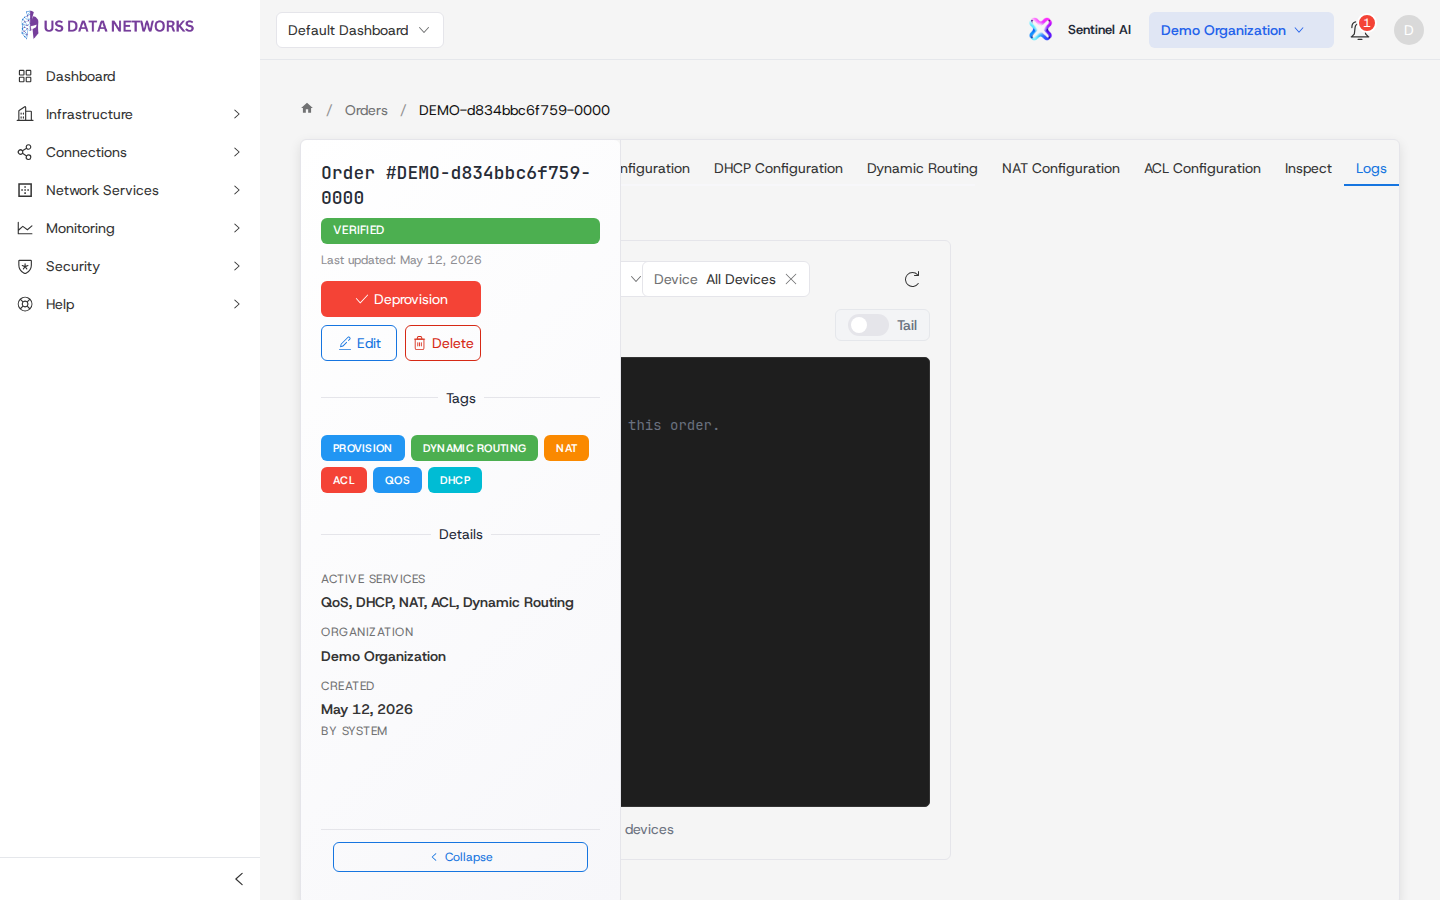
Logs
Open the Logs tab to stream or browse order- and device-related log lines tied to this order. This is the first place to look when activation fails, partial failures appear, or you need evidence for support tickets.
Inspect
The Inspect tab (when present) surfaces structured diagnostics for engineers—use it alongside Logs when support asks for deeper technical context.
Topology and tunnels
When the order has an associated topology:
- Topology shows the logical layout.
- Tunnels lists tunnel records with counts in the tab title; drill in for per-tunnel state.
These views complement tunnel setup documentation for day-2 operations.
Related guides
Need help?
See Support & Escalation.